I just recently got Visual Studio Code hooked up with the virtual Vagrant machine hosting my local dev version of WordPress. I’m posting the steps I took here. In the end it’s fairly simple to do.
Most of the guides out there show you how to hook up VS Code with a locally running copy of WordPress. However, I’m using Chassis.io for my dev version of WordPress. Chassis.io makes use of Vagrant and a virtual machine. I did not find anything that showed me how to hook VS Code with a copy of WordPress running on a virtual machine, as is the case with a Chassis.io setup.
This post assumes that you’ve already setup the Chassis XDebug extension.
Setup Chassis for Debugging with Visual Studio Code
The first thing we need to do to setup the Chassis XDebug extension to work with Visual Studio Code is to setup the IDE Key. Setting up the IDE Key consists of two steps.
- Set the IDE Key in the Chrome XDebug Helper extension. (You should have this extension if you followed the Chassis XDebug Extension setup guide)
- Set the IDE Key for the Vagrant machine.
Set the IDE Key in the XDebug Helper Extension
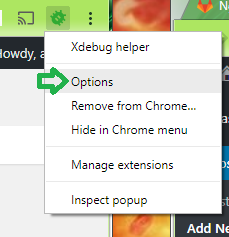
Bring up the XDebug Helper extension options page. You can do this by Right Clicking the extension icon and selecting Options.
Find the section for the IDE Key. Select Other as the default sessionkey and type in VSCODE.
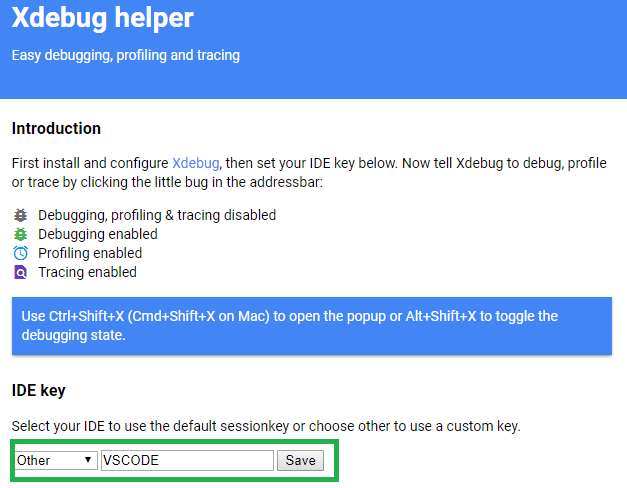
Save it. Next we need to set the IDE Key for the Vagrant machine.
Set the IDE Key for the Vagrant Machine
This step is pretty simple. First you need to navigate to the root Chassis directory. Mine is located at C:\projects\chassis.
- Create a config.local.yaml file if one doesn’t already exist.
- Add
ide: VSCODEto the config.local.yaml file. - Run
vagrant provisionwhich should update the settings on your local vagrant machine.
To confirm that the IDE Key is indeed VSCODE see the “xdebug” section on the PHPInfo page for the machine.
Example: http://vagrant.local/phpinfo.php
Setup Visual Studio Code for Debugging with Chassis
If you are using Visual Studio Code to develop PHP than you should install the PHP Extension Pack. Bring up the VS Code Extensions menu and search for “PHP Extension Pack”. This extension will include the PHP Intellisense plugin and the PHP Debugger plugin. You will need the PHP Debugger plugin for debugging.
Next we need to setup a debugging configuration.
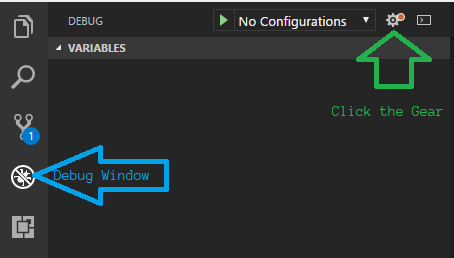
- Bring up the VS Code debugging window.
- Click the “Gear” icon.
- Select “PHP” as your environment from the popup textbox.
Now you will see a “launch.json” file in your VS Code window. This contains some default settings for debugging PHP. The file will not work for our purposes as it is. We need to add a couple properties to the JSON to hook VS Code up with our WordPress site.
serverSourceRoot– This is the directory for your code on the server (Chassis.io).localSourceRoot– This is the directory for your code on your development machine.
The serverSourceRoot needs to be the path to your source code on the server. In my case the value is /vagrant/content/plugins/my-awesome-plugin.
The localSourceRoot is used to match the server source up with your local source. In my case I set this to ${workspaceRoot} which is a special variable referring to the path of the opened folder in VS Code.
In the end my launch.json file looked like this:
{
    "version": "0.2.0",
    "configurations": [
        {
            "name": "Listen for XDebug",
            "type": "php",
            "request": "launch",
            "port": 9000,
            "serverSourceRoot": "/vagrant/content/plugins/my-awesome-plugin",
            "localSourceRoot": "${workspaceRoot}"
        },
        {
            "name": "Launch currently open script",
            "type": "php",
            "request": "launch",
            "program": "${file}",
            "cwd": "${fileDirname}",
            "port": 9000
        }
    ]
}
All Done
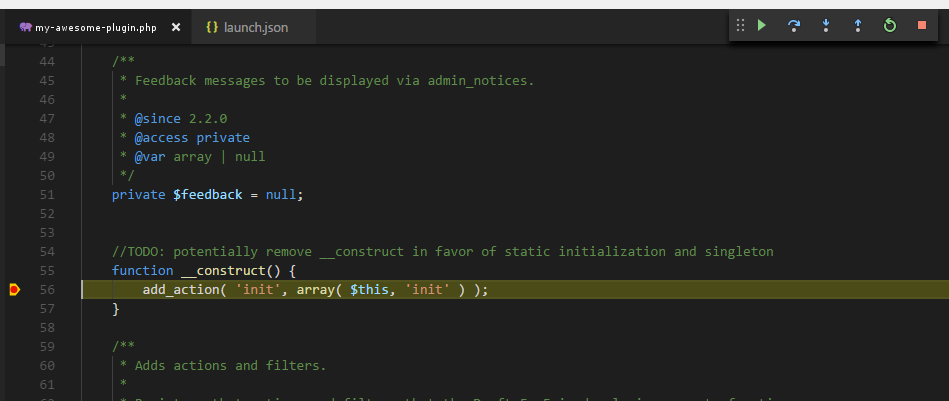
Alright! That should be it. Save your launch.json file, set a breakpoint in your code, and start the debugger. When you visit the relevant WordPress page on your Chassis box you will notice your breakpoint is hit.